Seatrade-Maritime: Port connectivity index reveals tumbling crises are engines of change

Published by Seatrade-Maritime
The Port Liner Shipping Connectivity Index (PLSCI) scrutinised the fine tuning under liner shipping’s bonnet and found that successive crises during this decade have had a fundamental impact on trading patterns.
Developed jointly by UN trade body, UNCTAD, and MDS Transmodal, the PLSCI measures how well ports are integrated into global liner networks across six components, including scheduled services, shipping companies, deployed capacity, and direct connections.
The Red Sea crisis triggered a widespread structural redesign in global trading that has stabilised at the top, most connected ports, while the dynamism is seen in the less-established facilities, reflecting the major shifts in trading patterns.
“Increasingly important changes in connectivity now reflect how networks are refined, rather than whether they are being fundamentally redrawn,” said MDS Transmodal’s senior analyst Antonella Teodoro.
One major change in trading patterns has been the growth in sub-Saharan connections since the disruption caused by the effective closure of the Red Sea and Suez Canal to most traffic in the latter part of 2023.
“Scheduled capacity offered to Sub-Saharan Africa has increased significantly over the past three years, underlining the region’s growing strategic importance within global liner networks. Between July 2023 and July 2026, each of the 10 largest operators serving Sub-Saharan Africa increased the capacity they offer to the region, although growth rates varied considerably,” said Teodoro.
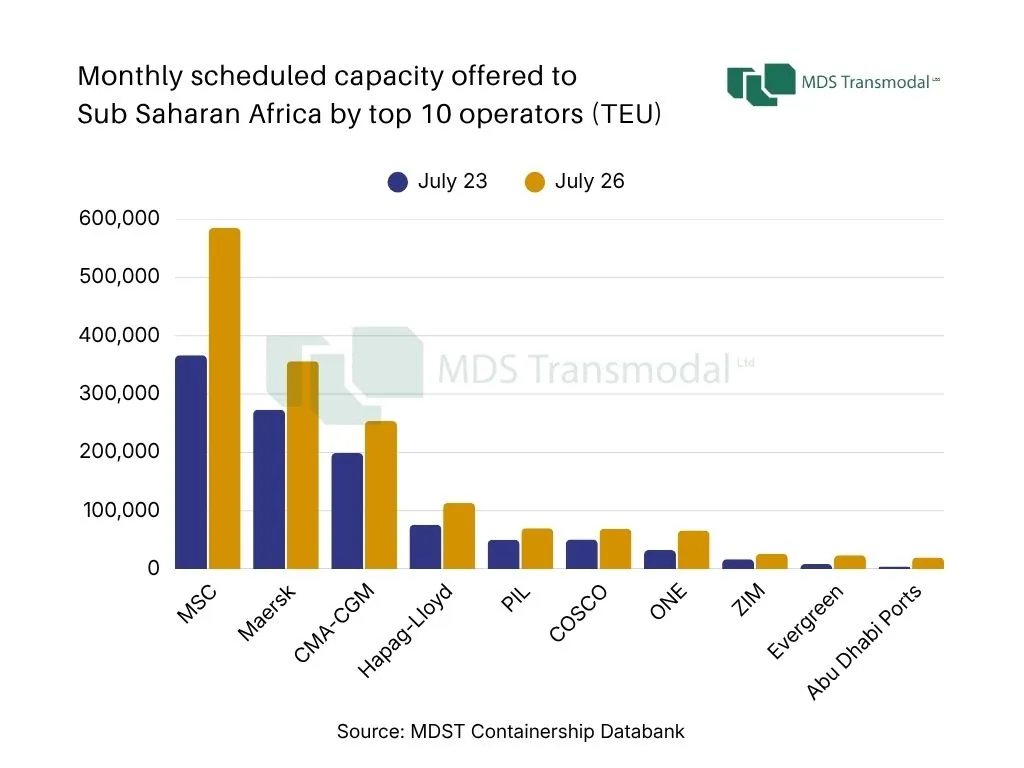
MSC has strengthened its market leadership, increasing scheduled capacity by 60% to almost 585,000 teu/month. Maersk and CMA CGM also recorded substantial increases of 31% and 28%, respectively, maintaining their positions among the region’s leading carriers.
Among the established global operators, Hapag-Lloyd, PIL, COSCO and ZIM all expanded capacity by between 37% and 57%, reflecting sustained confidence in Sub-Saharan African trade.
It is, however, the operators with the least regional capacity that have made the greatest percentage increases with ONE more than doubling its deployment, +102%, while Evergreen was up 173%.
Perhaps the most spectacular growth was from Abu Dhabi Ports which increased its offered capacity by 354%, “highlighting its rapidly growing presence in African liner services as it continues to strengthen its maritime and logistics footprint across the continent,” said Teodoro.
Regional competition will intensify in the future as port and infrastructure investment ramps up, said Teodoro who added: “The increase in deployed capacity reflects both the continued expansion of African trade and carriers’ efforts to position themselves for long-term growth opportunities.”
Away from Africa, global connectivity has entered a more stable phase as the world’s three most connected container ports remain firmly established, continuing even through the various crises in the Middle East, with Shanghai registering an increase in its index score from 2,106 -> 2,372, Ningbo up from 1,817 -> 2,041 and Singapore rising to 1,834 from 1,732.
Where the leading ports have shown stability, the facilities immediately beneath them in the hierarchy have been far more dynamic. Ports in South and Southeast Asia have significantly increased their connectivity over the past three years, in what Teodoro calls a “broad-based and structurally embedded in shifting trade and manufacturing patterns.”
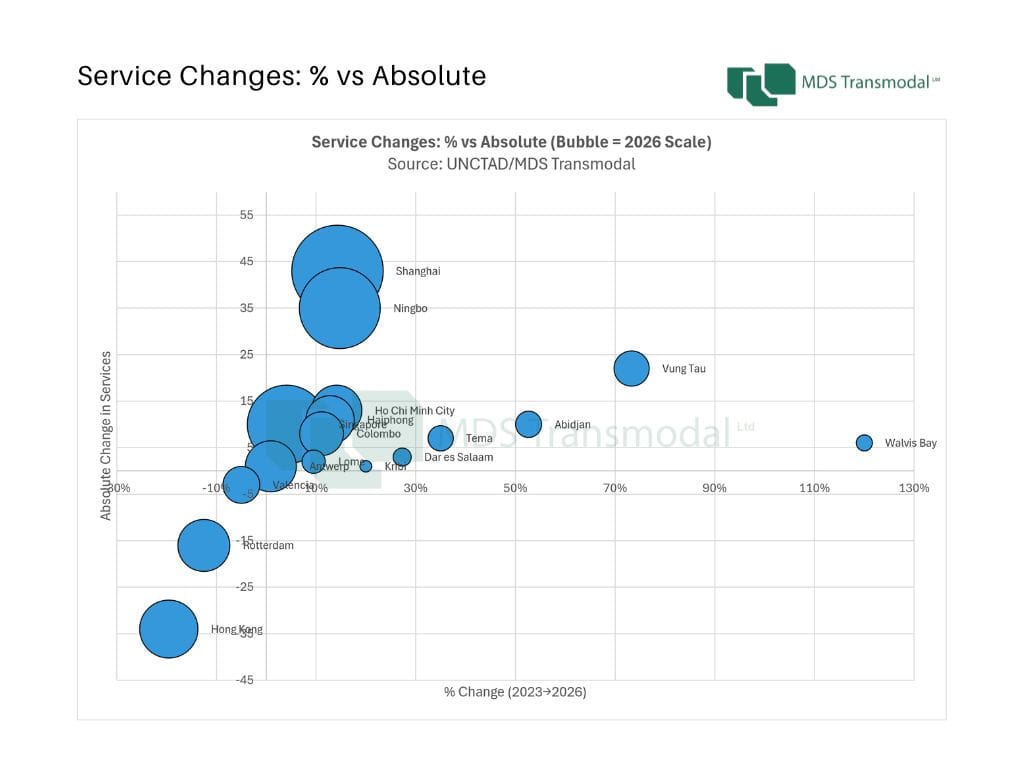
Colombo is the clearest example of what is described as a “sustained multi-dimensional expansion”.
Colombo’s PLSCI score increased 12% from 643 in Q2 2023 to 719 in Q2 2026, supported by increases in services 72 -> 80, operators 33 -> 36, deployed capacity 18.7m -> 22.4m teu and direct connections 116 -> 132.
“Importantly,” explained Teodoro, “Gains are distributed across all six components of the index, indicating genuine network deepening rather than isolated capacity expansion or cyclical recovery. Vietnam shows a similar trajectory, albeit from different starting points.”
Haiphong’s connectivity scores increased 20% from 577 to 690, Ho Chi Minh City was up 9% to 620, and Vung Tau has seen a significant expansion in deployed capacity from 14.1m -> 24.2m teu, reflecting its growing role in regional handling and transhipment.
“Together, these trends point to a gradual but persistent redistribution of connectivity towards a broader Southeast Asian corridor. Rather than being concentrated in China’s established gateways, incremental network growth is now being absorbed by secondary and emerging regional hubs embedded in manufacturing diversification strategies.”
Related Posts